Table of Contents
Introduction
We have several Raspberry Pi Pico Ws throughout the house which collect temperature and humidity measurements and a corresponding web interface which shows the current measurements, charts of recent measurements, and the weather forecast for the next few days.
Here is a picture of the web interface:
Current Data, Charts, and Forecast panels in the desktop web interface (2024).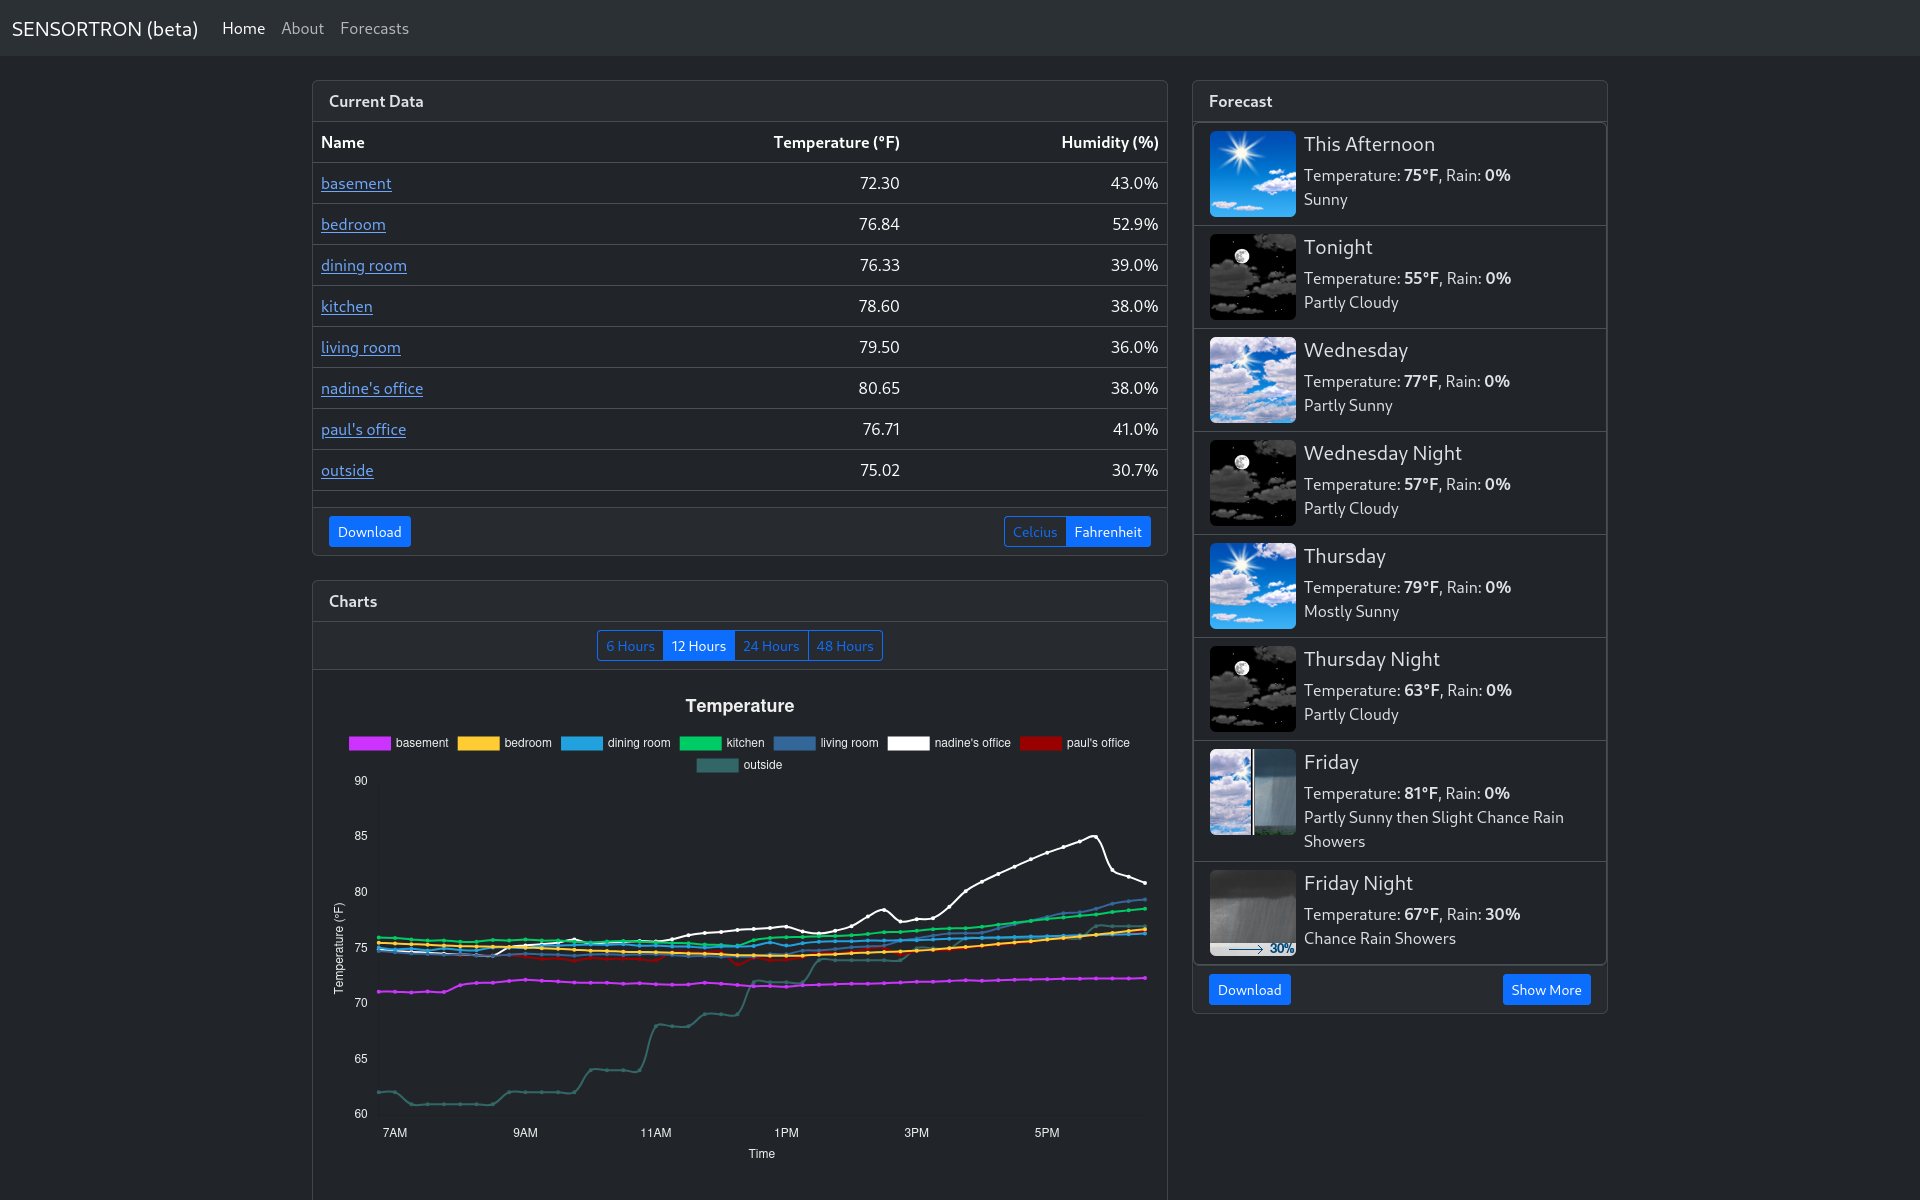
The following sections describe the history of this project, the hardware, the software on the Pico Ws, and the software behind the web interface.
Note: Home Assistant or an Ecobee are both more practical solutions; this started as a tinkering project that accidentally became useful for us.
That said, there is some value in controlling all of the hardware and software; none of our our data leaves our home network, we don’t have to create an account on a ridiculous online hub with a dubious privacy policy, and we don’t have to worry about our devices being bricked in a couple of years.
History
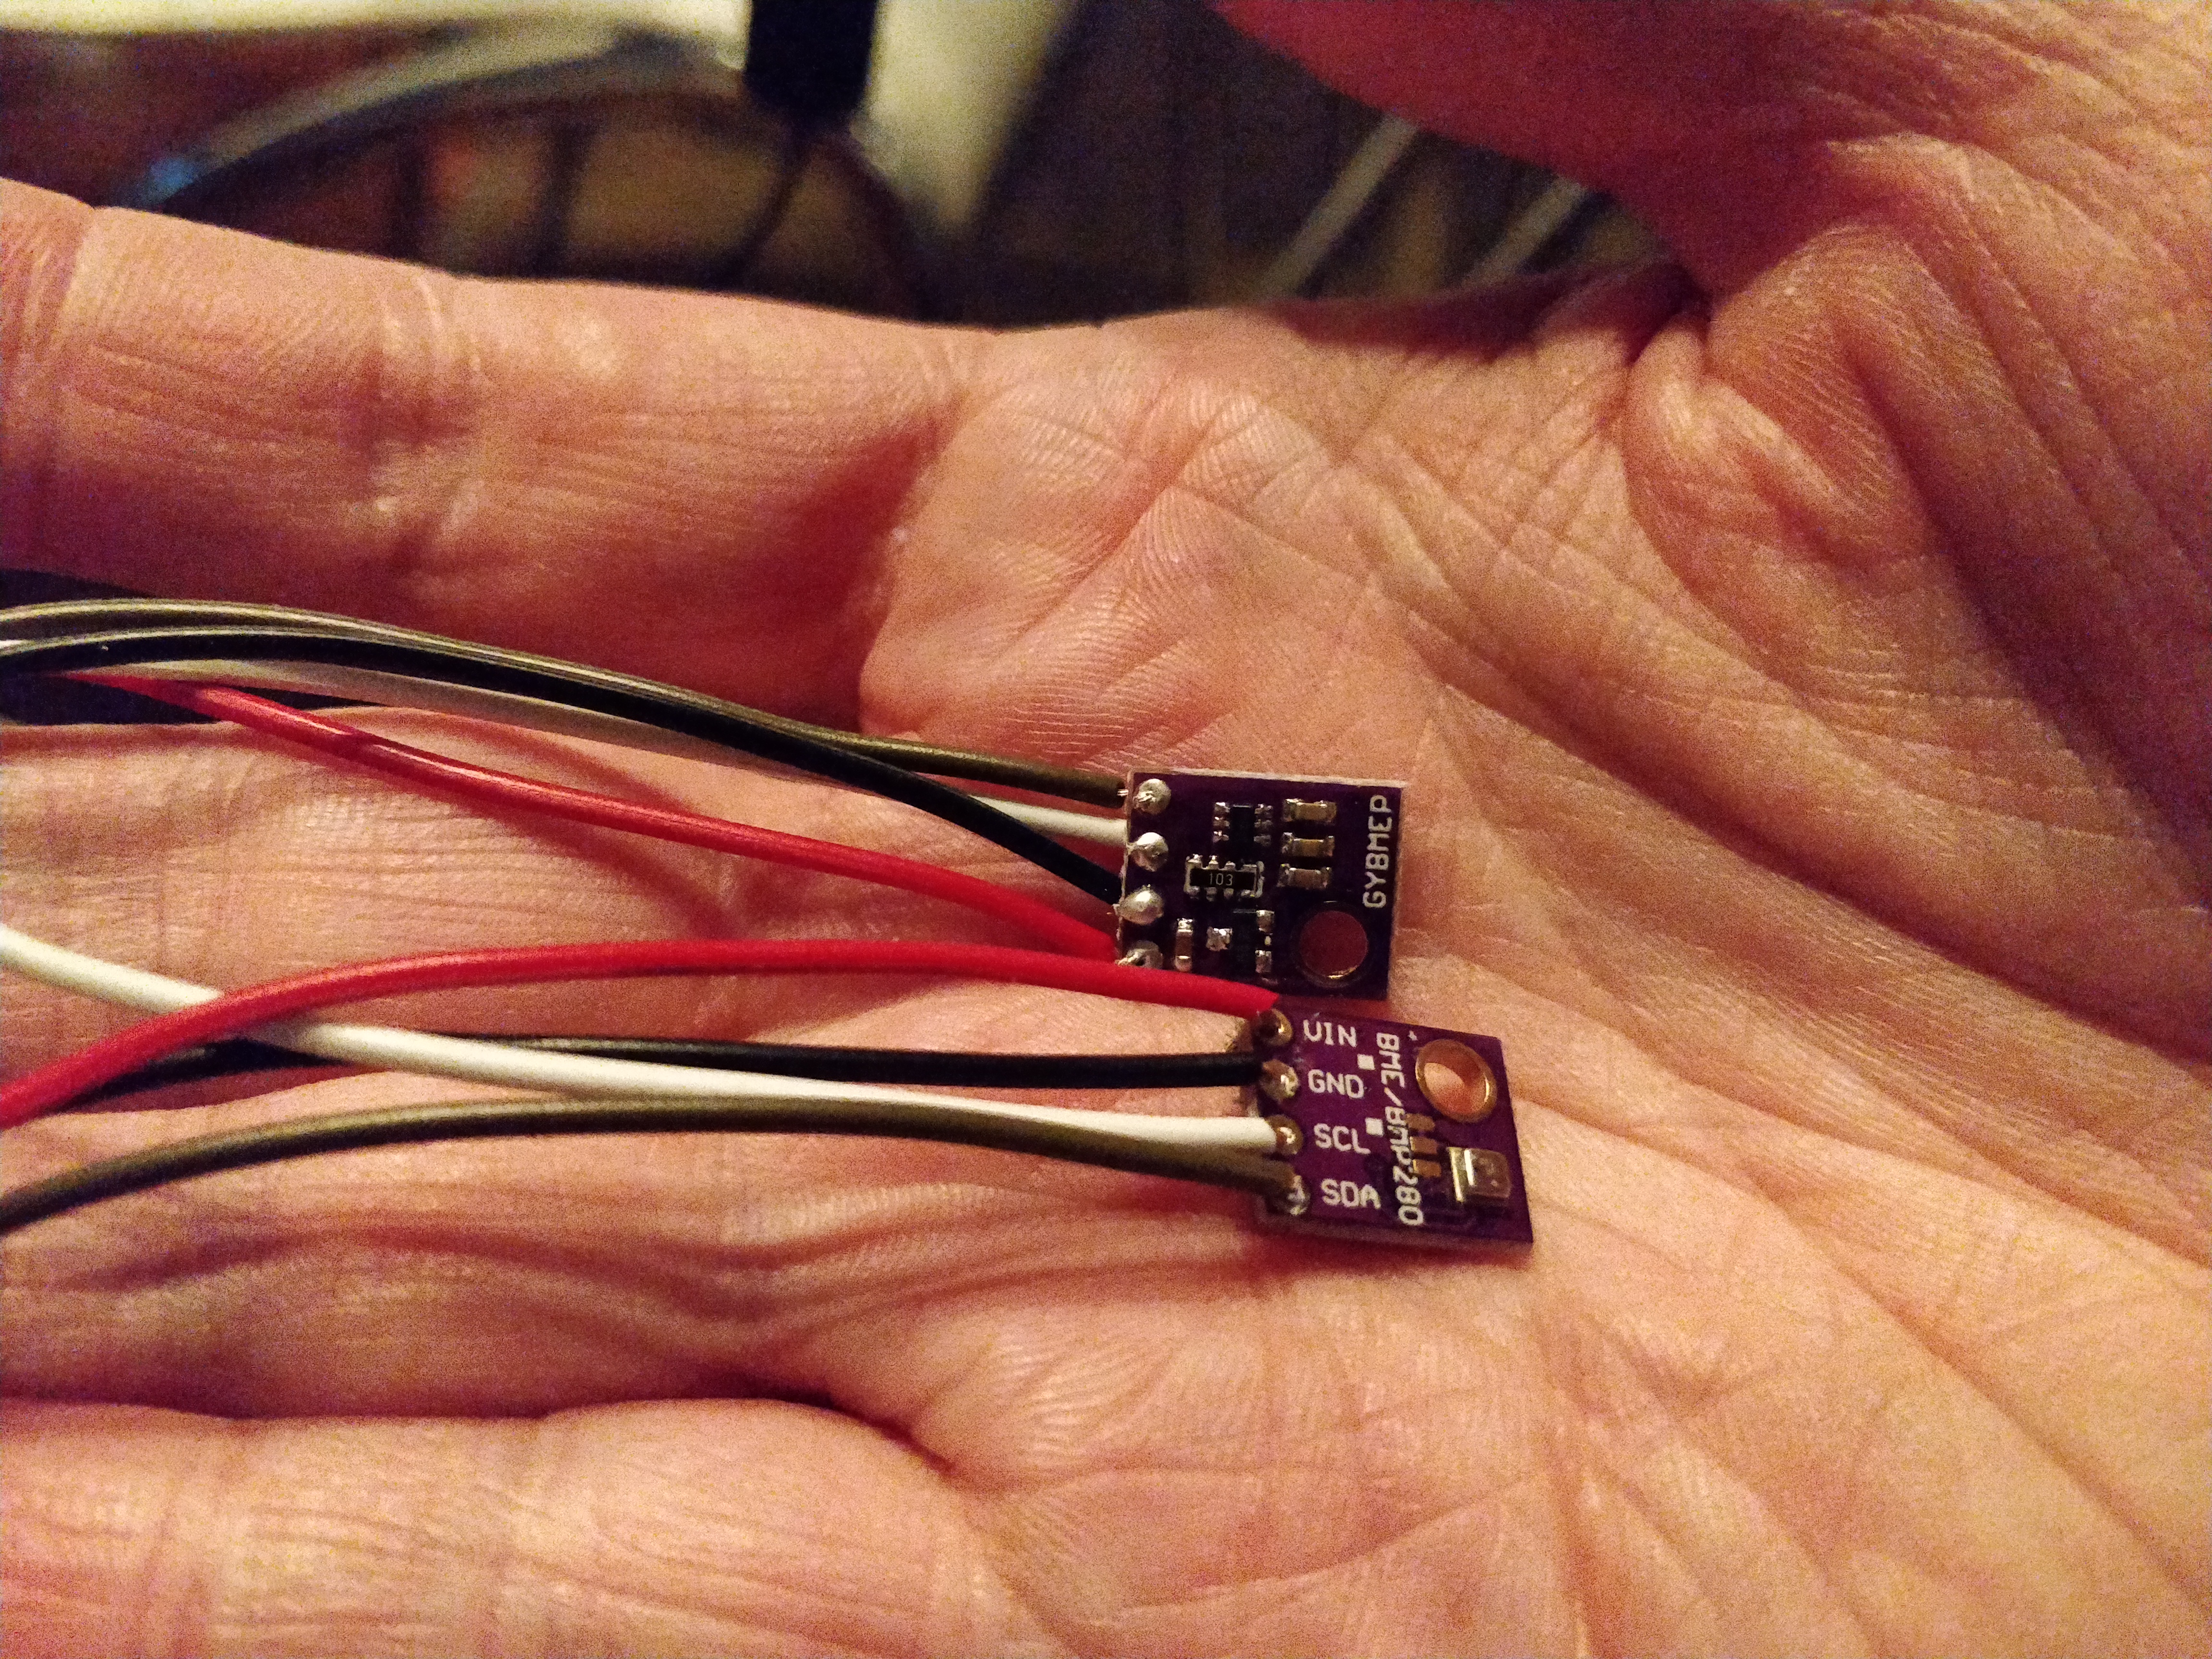
In 2018 I attached BME280 sensors to our Raspberry Pi 3 HTPCs and created a minimal web interface to view the sensor measurements.
Here is a picture of the original BME280 sensors:
Here is the original bedroom Pi 3 HTPC with a BME280 sensor attached:
Bedroom Pi 3 HTPC with BME280 sensor attached.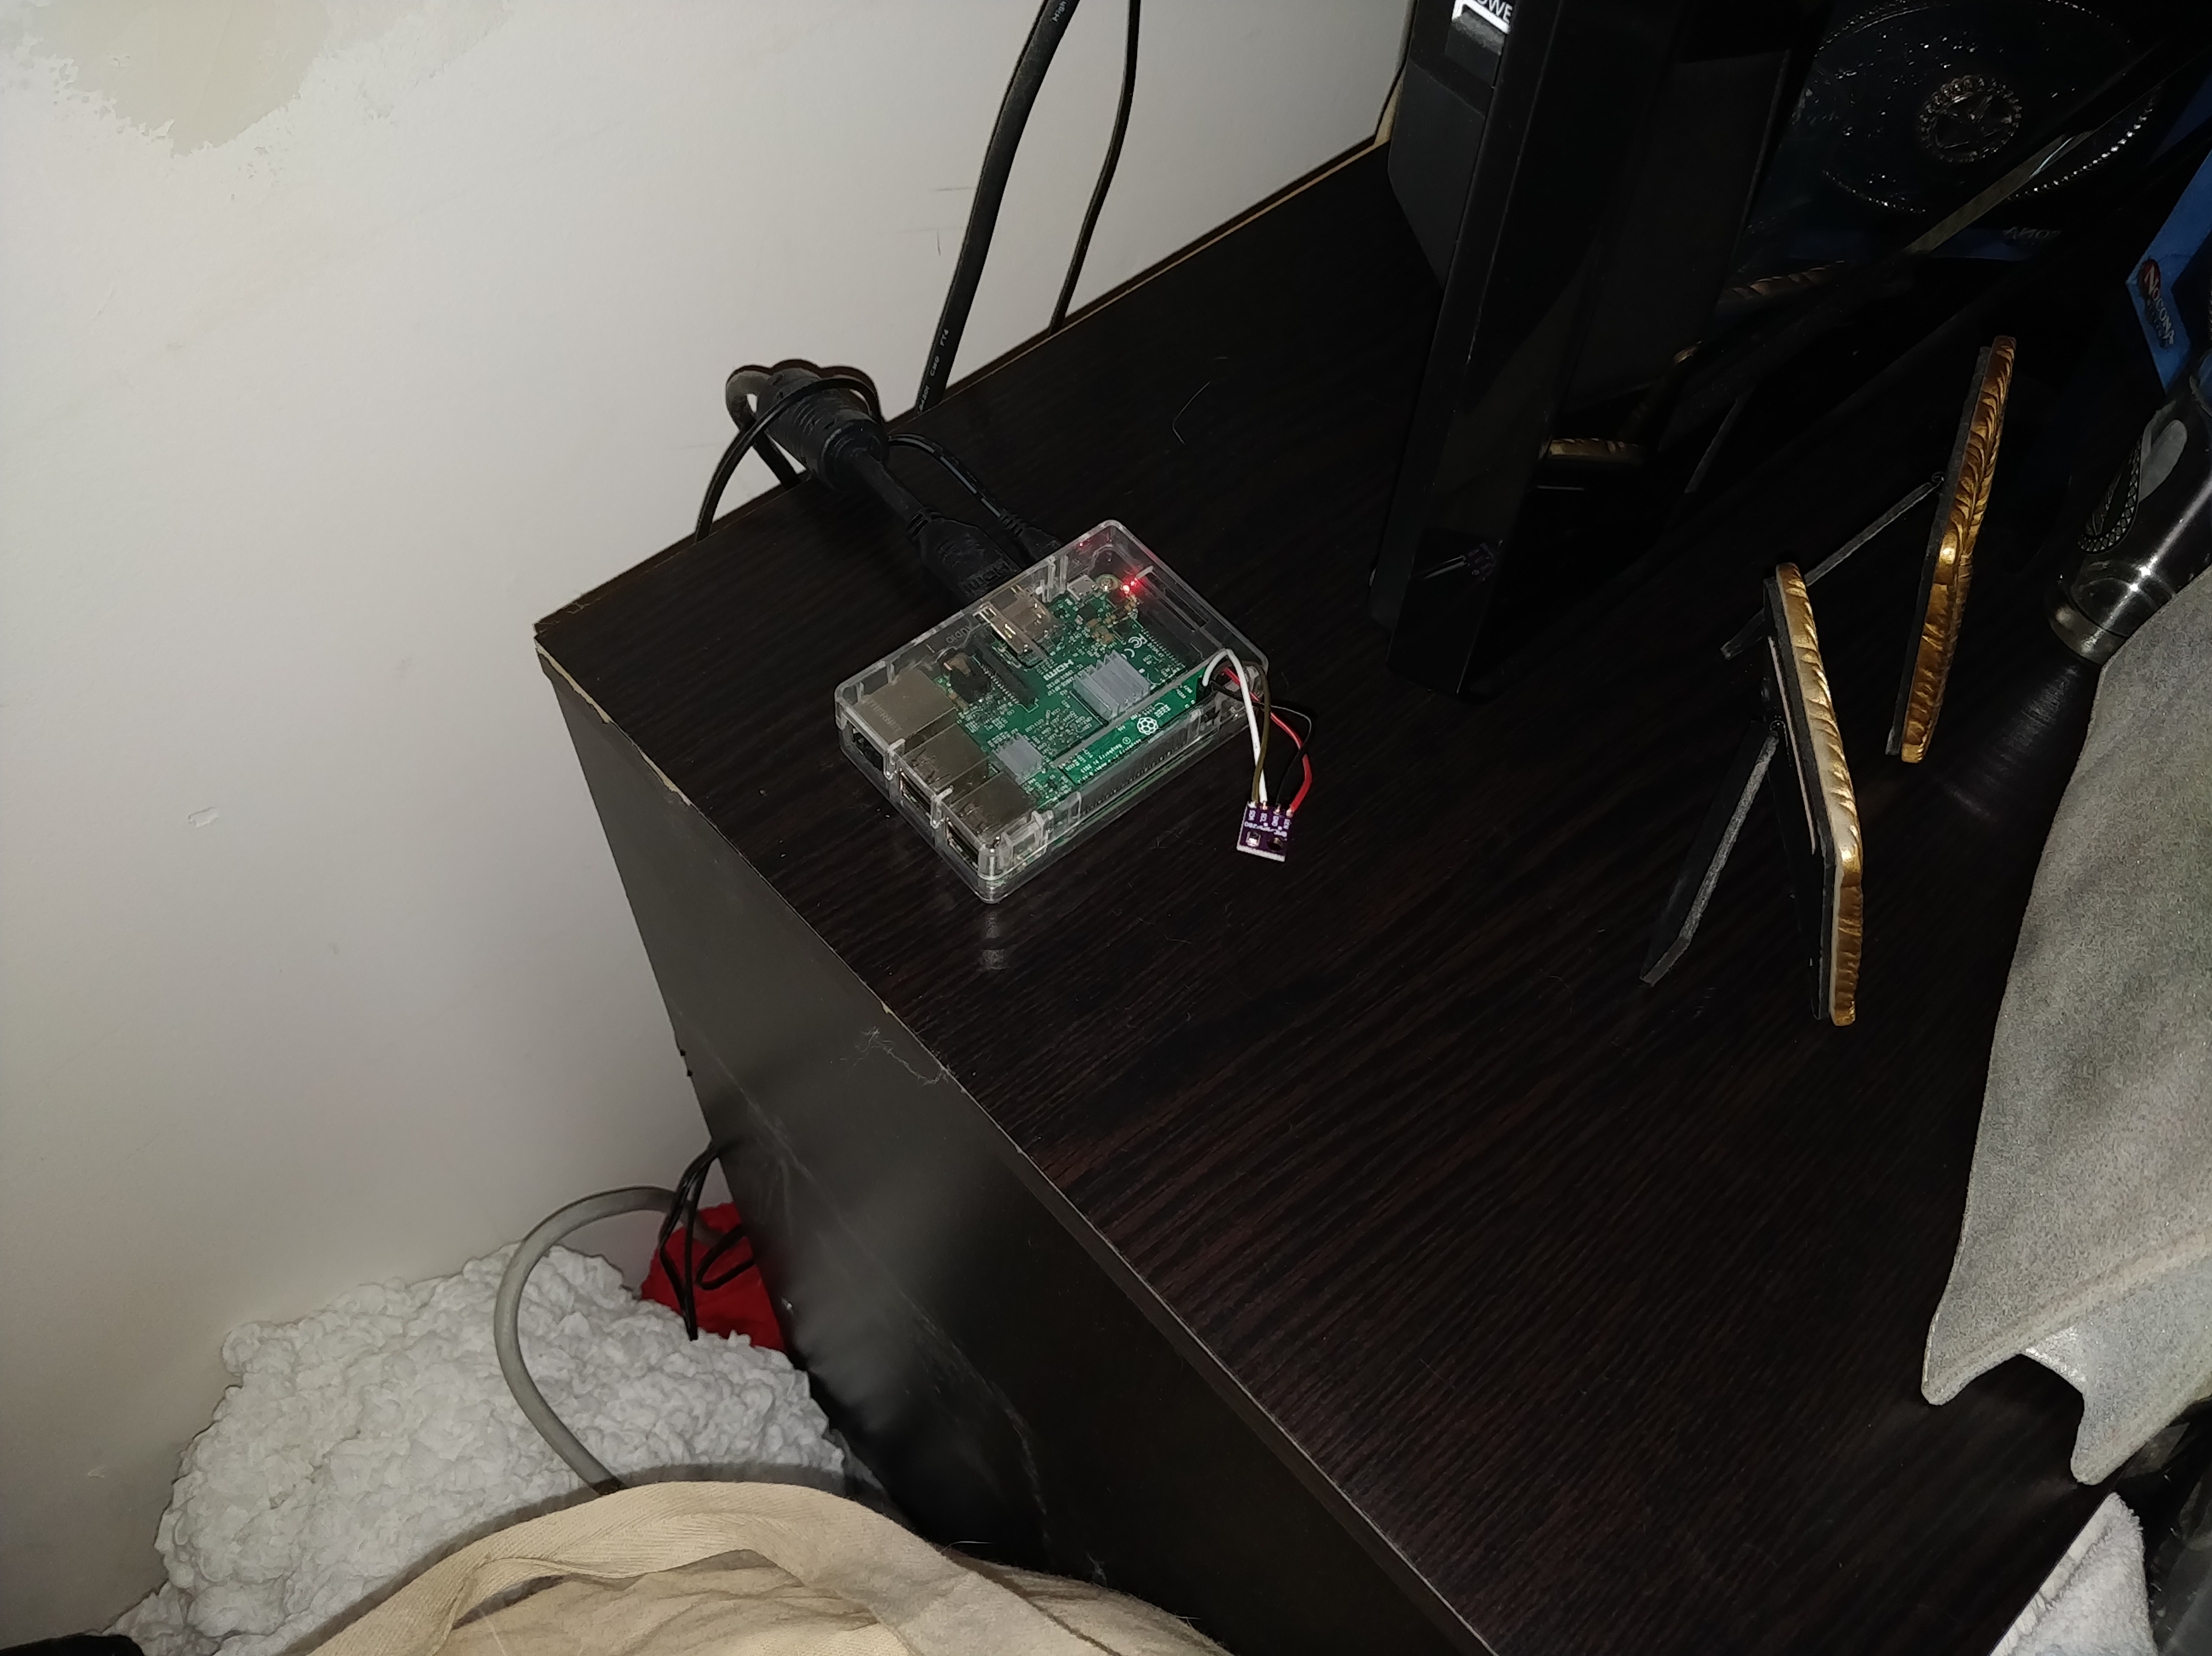
And here is the original web interface (yikes!):
Original web interface (2018).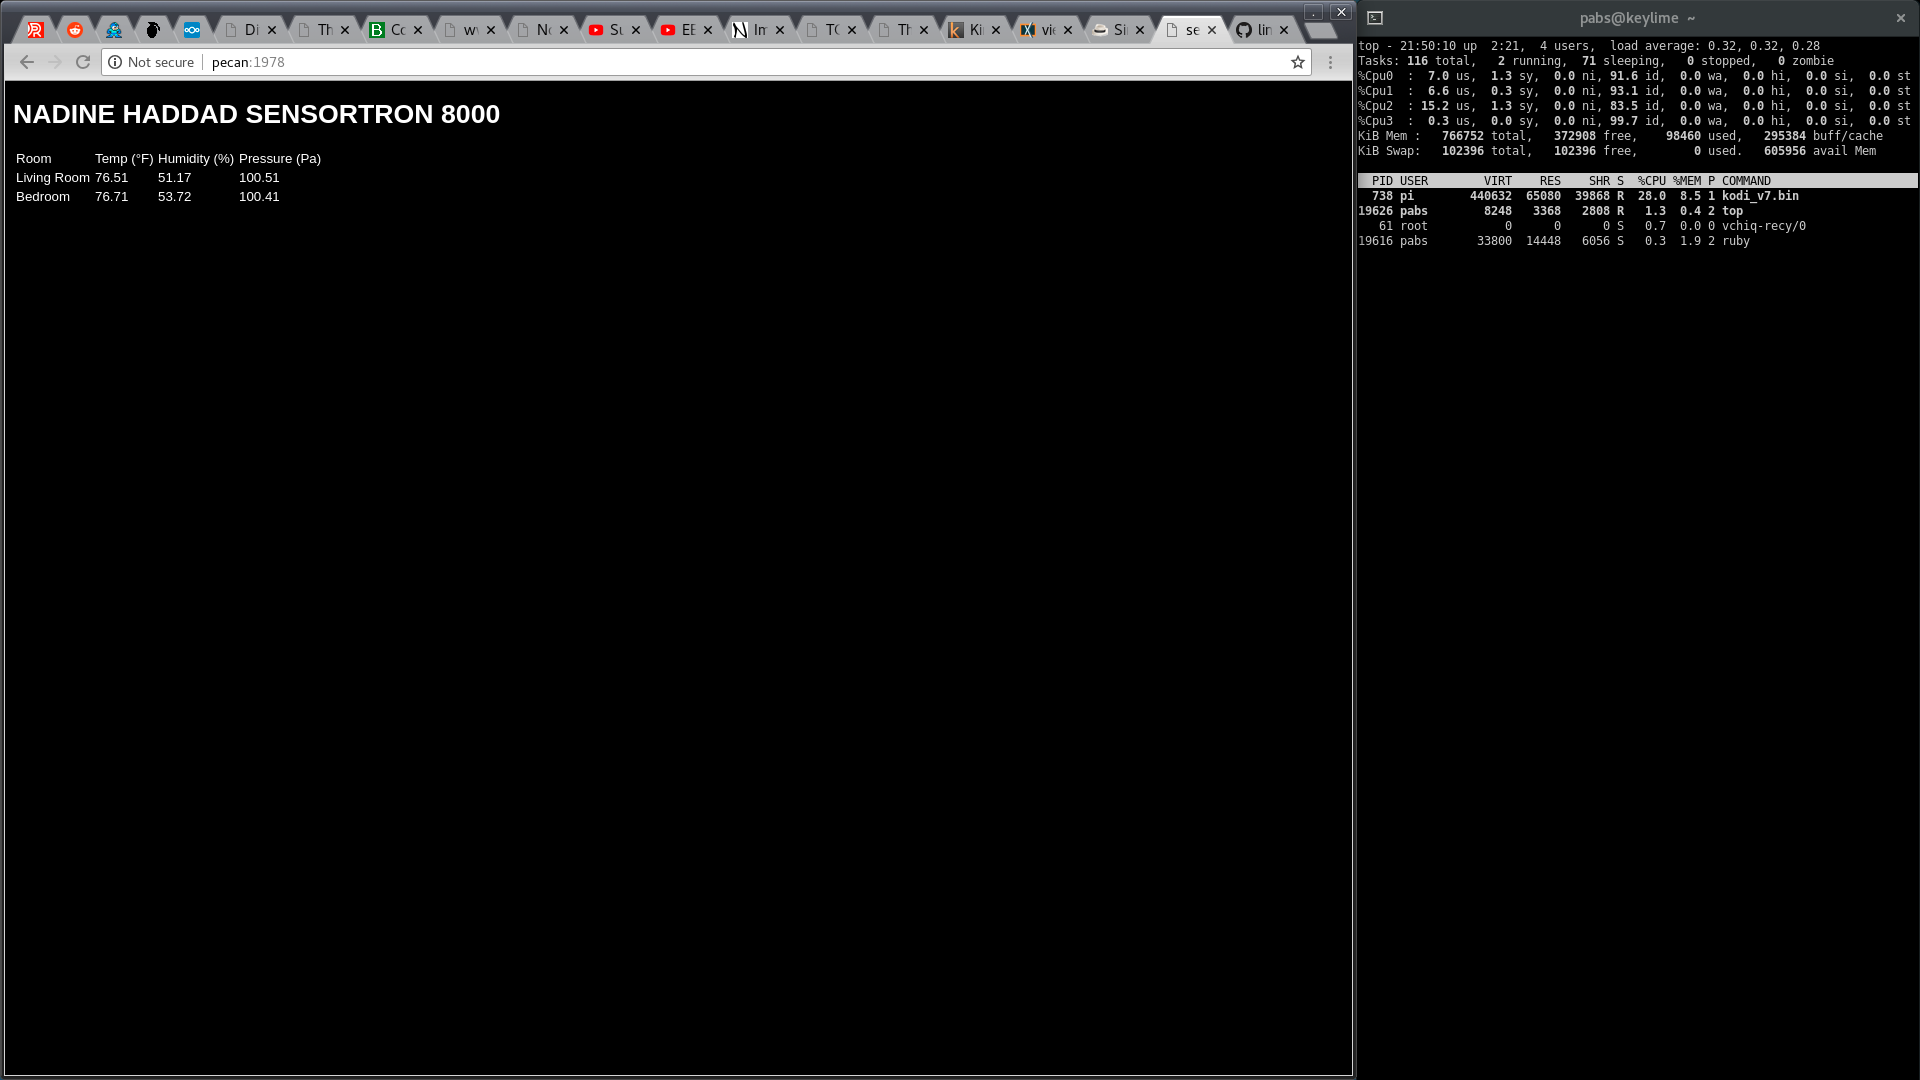
In 2019 I added a third sensor attached to a Raspberry Pi Zero W in the basement and outdoor measurements pulled from the National Weather Service (NWS) API.
I also made several improvements to the web interface:
- Redesigned in Bootstrap 4.
- Added chart.js-based charts.
- Added weather forecast from NWS API.
Here is the improved web interface from 2019:
Improved web interface (2019).
The setup above worked for several years, but the software was a mishmash of undocumented Ruby, shell scripts, and cron jobs.
This caused several problems:
- It was difficult to install and difficult to maintain.
- It required a full Raspberry Pi running Linux. This was fine for the dual-use Pi 3 HTPCs, but it felt like a waste of a Pi Zero W.
- The web interface queried the status of all sensors on page load (pull model). This made the page unnecessarily slow.
- The web interface would fail to load when sensors were inactive or unreachable.
- The charts in the web interface were not mobile-friendly.
- It collected several measurements that we never used, like load average and network quality.
- The collected data was concatenated to a CSV file rather than inserted atomically into a database. This made it slow and difficult to query.
- When we moved we needed more sensors, but I didn’t want to “waste” any more Pi Zero Ws or deal with the hassle of setting up the software.
In 2022 I bought a spool of Pico Ws to replace the existing hardware and decided to rewrite the web interface to address the problems listed above.
The Pico Ws sat unused for a couple of years because I didn’t have a good work area. In 2023 we lost two of the sensors:
- one failed during a botched Pi Zero W Bookworm upgrade.
- one failed for no apparent reason.
In 2024 we set up my home office and I started working on the new hardware and software.
Hardware
Raspberry Pi Pico Ws microcontrollers with BME280s connected via I2C. Here are three of them:
Pico Ws with BME280 sensors attached.
Fritzing is on the fritz for me at the moment so I don’t have a pinout diagram. Here is a pinout table instead:
| Wire Color | Pico W | BME280 |
|---|---|---|
| Red | #36, 3V3(OUT) | VIN |
| Black | #3, GND | GND |
| Yellow | #6, GP4, I2C0 SDA | SDA |
| Green | #7, GP5, I2C0 SCL | SCL |
Software
The software is available in the Sensortron Git repository. The repository contains two directories:
pico-w/: Pico W Micropython code which periodically collects and sends BME280 sensor measurements to an API endpoint.web/: Web interface which shows sensor measurements and the weather forecast.
Pico W
Micropython script in the pico-w/ directory of the Sensortron Git
repository which runs on the Pico Ws and does the
following:
- Read the configuration from
config.py. - Initialize the BME280 sensor attached to I2C bus 0.
- Connect to the Wi-Fi network.
- Read sensor values every 10 seconds and send them to an API endpoint.
The code for the logic above is in pico-w/main.py.
Installation is documented and straightforward:
- Flash latest Pico W Micropython image.
- Copy
main.pyandbme280.pyto the Pico W. - Edit
config.pyand copy it to the Pico W.
Here is an example config.py:
# diningroom.py: example sensortron configuration file

# wifi ssid and password (required)
WIFI_SSID = 'YOUR-WIFI-SSID'
WIFI_PASSWORD = 'YOUR-WIFI-PASSWORD'

# api url (required)
URL = 'http://sensors.home.pmdn.org:1979/api/read'

# pseudo-mac secret (optional, defaults to '' if unspecified)
SECRET = 'SOME-SECRET-STRING'

# host name (optional, defaults to pico-$UNIQUE_ID if unspecified)
HOSTNAME = 'pico-diningroom'
Web interface
Web interface in the web/ directory of the Git repository
which shows current sensor measurements, a filterable chart of recent
sensor measurements, and the weather forecast for the next several days.
The web interface also exposes an HTTP API endpoint which the Pico Ws use to submit their current sensor readings.
The appearance of the current web interface is similar to the older 2019 web interface, but with many improvements.
Backend improvements:
- Written in Go.
- Two dependencies: go-chi and modernc.org/sqlite.
- Web assets are embedded in the binary.
- Periodic tasks are handled in goroutines spawned from the binary rather than a set of cron jobs.
- Data is stored in a SQLite database.
- Sensors post measurements to an API endpoint (push model).
- Built and deployed as single static binary in a a small (<20M)
container. The build is multi-stage and the output image is
based on distroless. Persistent data is stored in one place
(
/data) so the container is volume-friendly.
Frontend improvements:
- Bootstrap 5.3 and chart.js 4.4.
- Sensor display parameters (name, color, and sort order) are now editable via the web interface.
- Charts are now responsive and render correctly on desktop and mobile.
- Charts can be downloaded as PNG images.
- Removed unused features. Example: air pressure.
- Added new useful features. Example: probability of precipitation.
- Interface refreshes automatically without a page reload.
The home page loads instantly with these improvements. It’s also much easier to update, build, and deploy. Here’s the one-liner I use to deploy, split into multiple lines for legibility:
# - pull latest code from git repo
# - build image
# - stop old container (if any)
# - start new ephemeral container named "sensortron" which exposes port
#   1979, and uses the "sensortron" volume
git pull && podman build -t sensortron . && (
  podman stop sensortron;
  podman run -d --rm -p 1979:1979 -v sensortron:/data --name sensortron sensortron
)
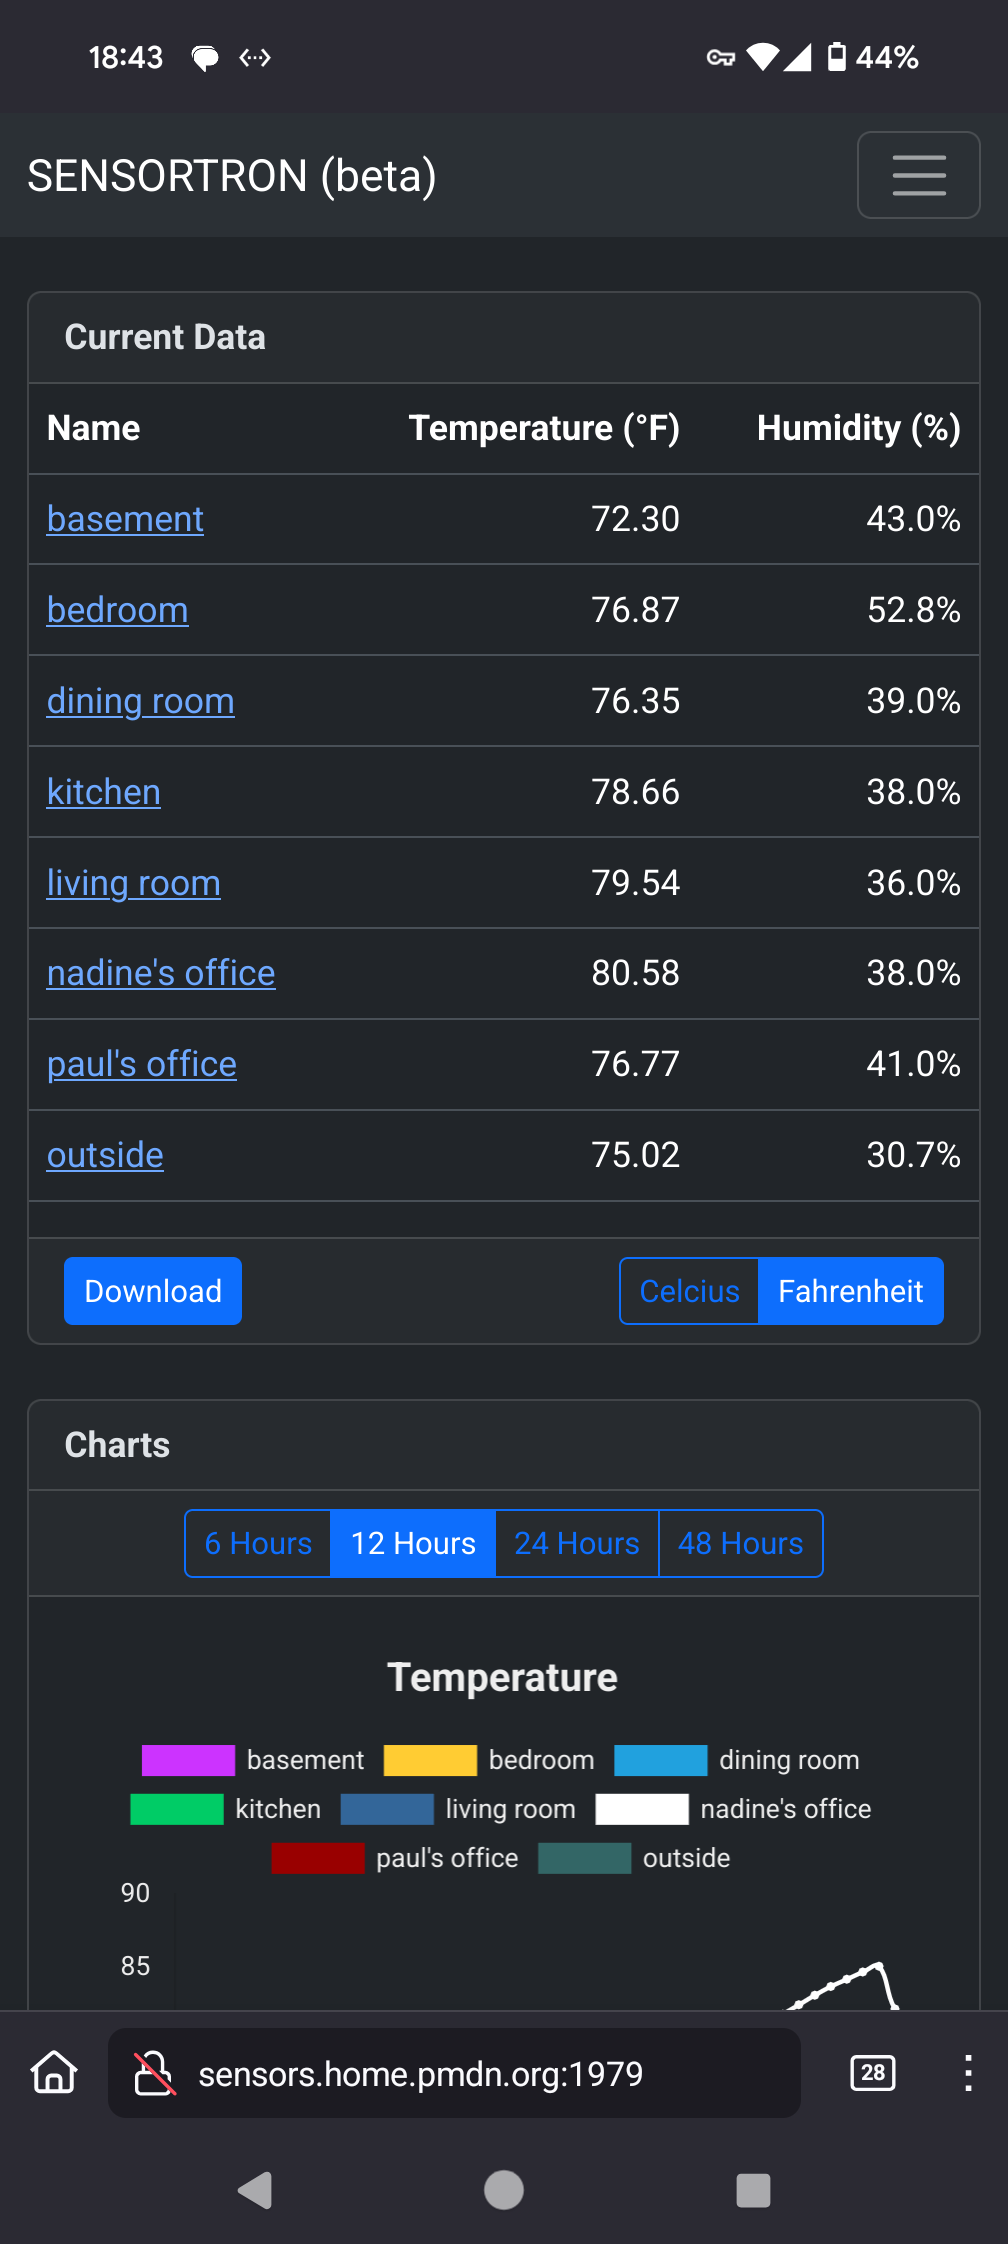
Here are the current data, charts, and forecast panels on the home page of the 2024 web interface:
Current Data, Charts, and Forecast panels in the desktop web interface (2024).
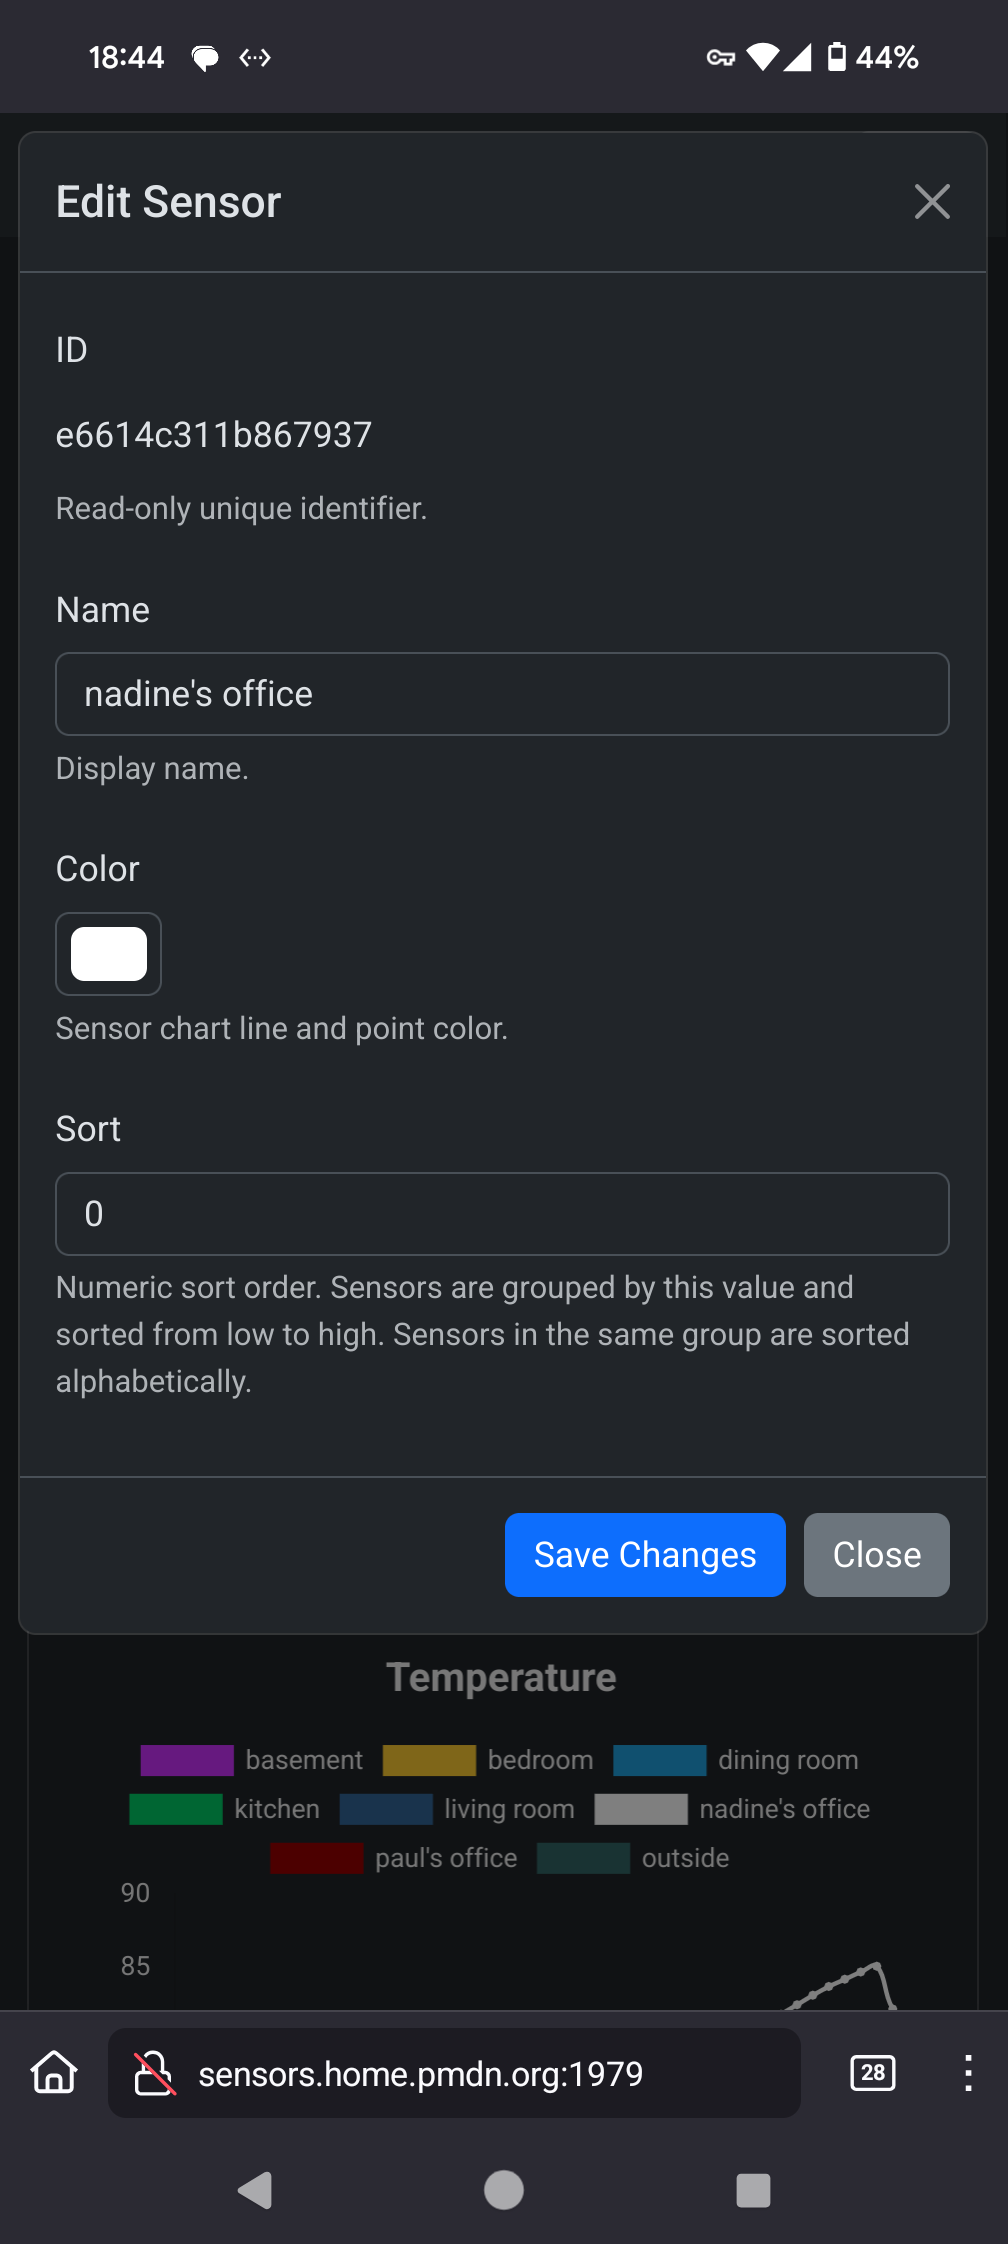
Edit Sensor dialog:
Edit Sensor dialog in the desktop web interface (2024).
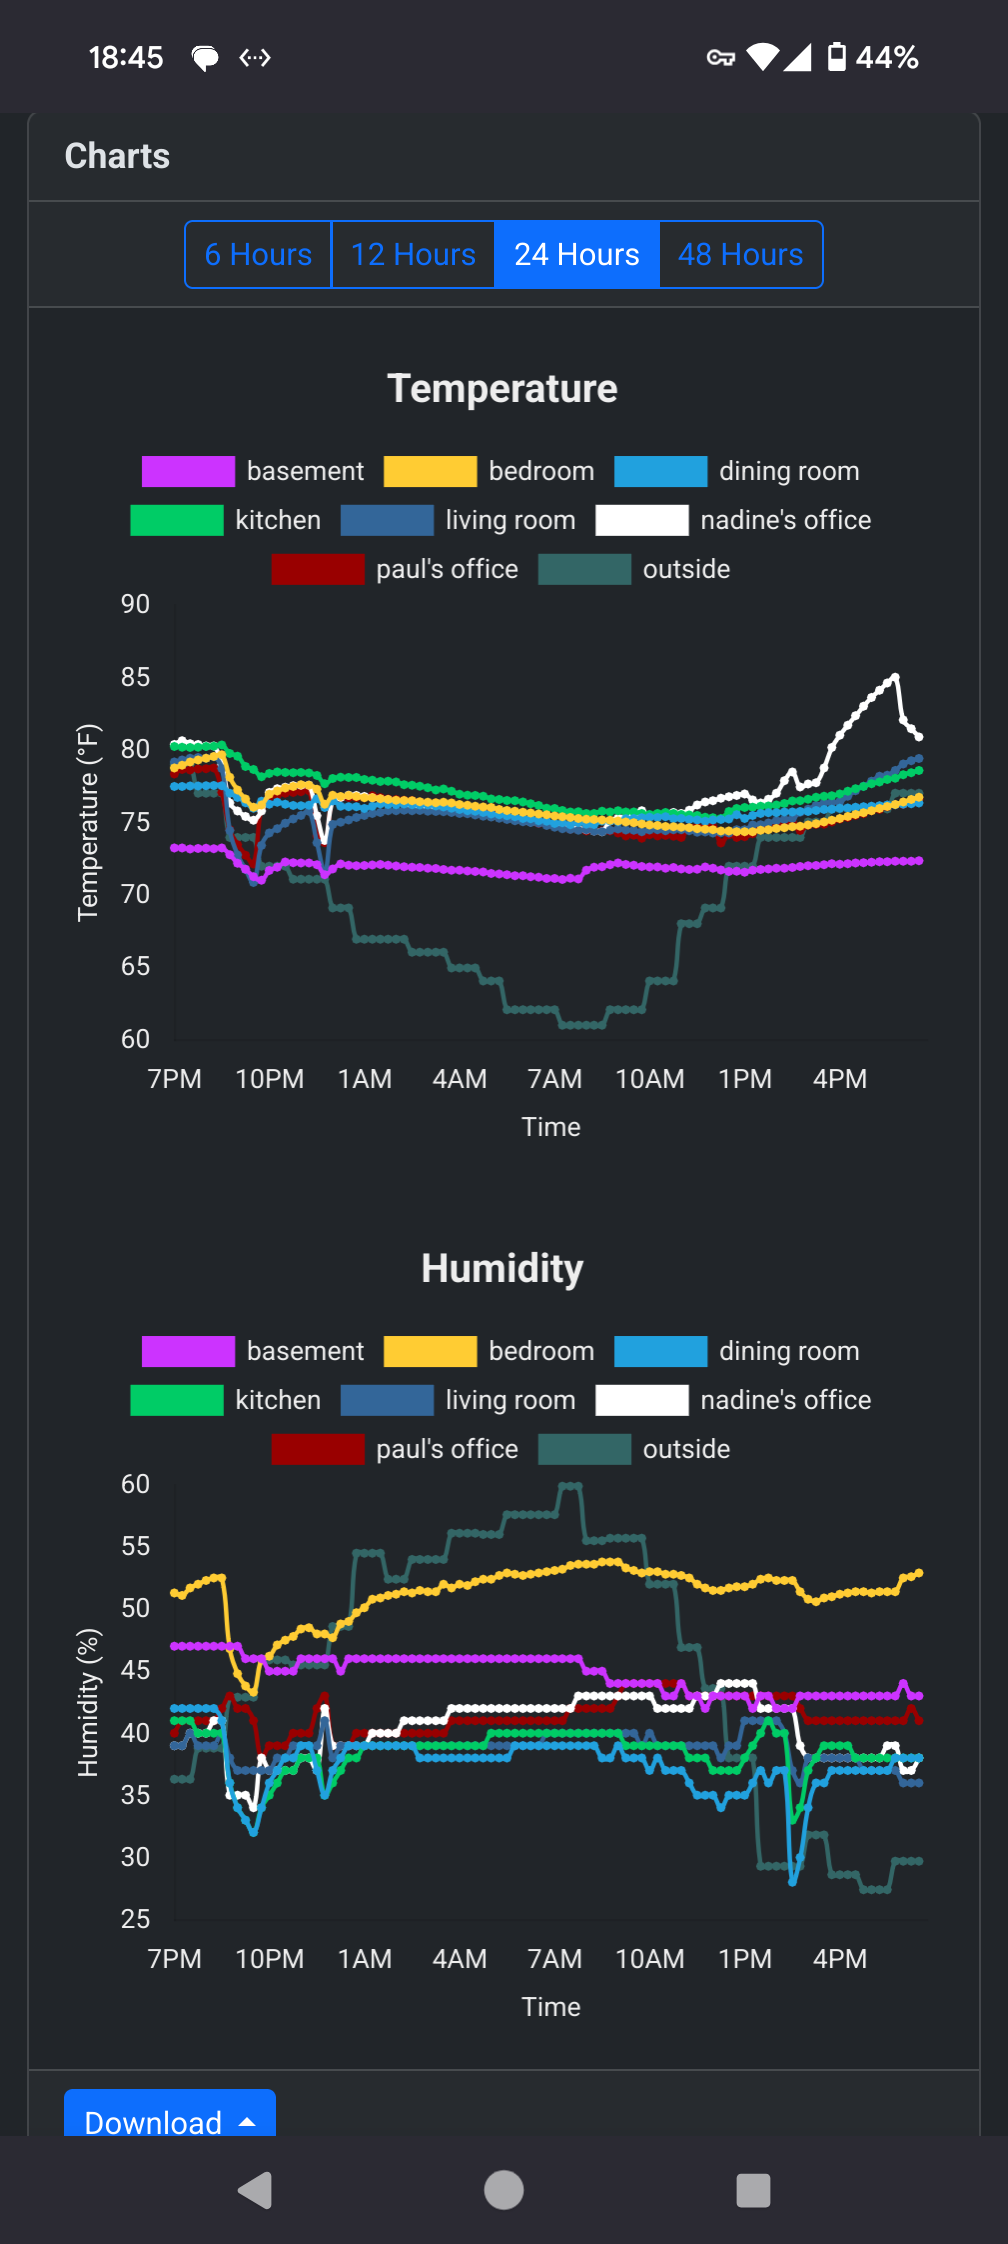
Charts panel:
Charts panel in the desktop web interface (2024).
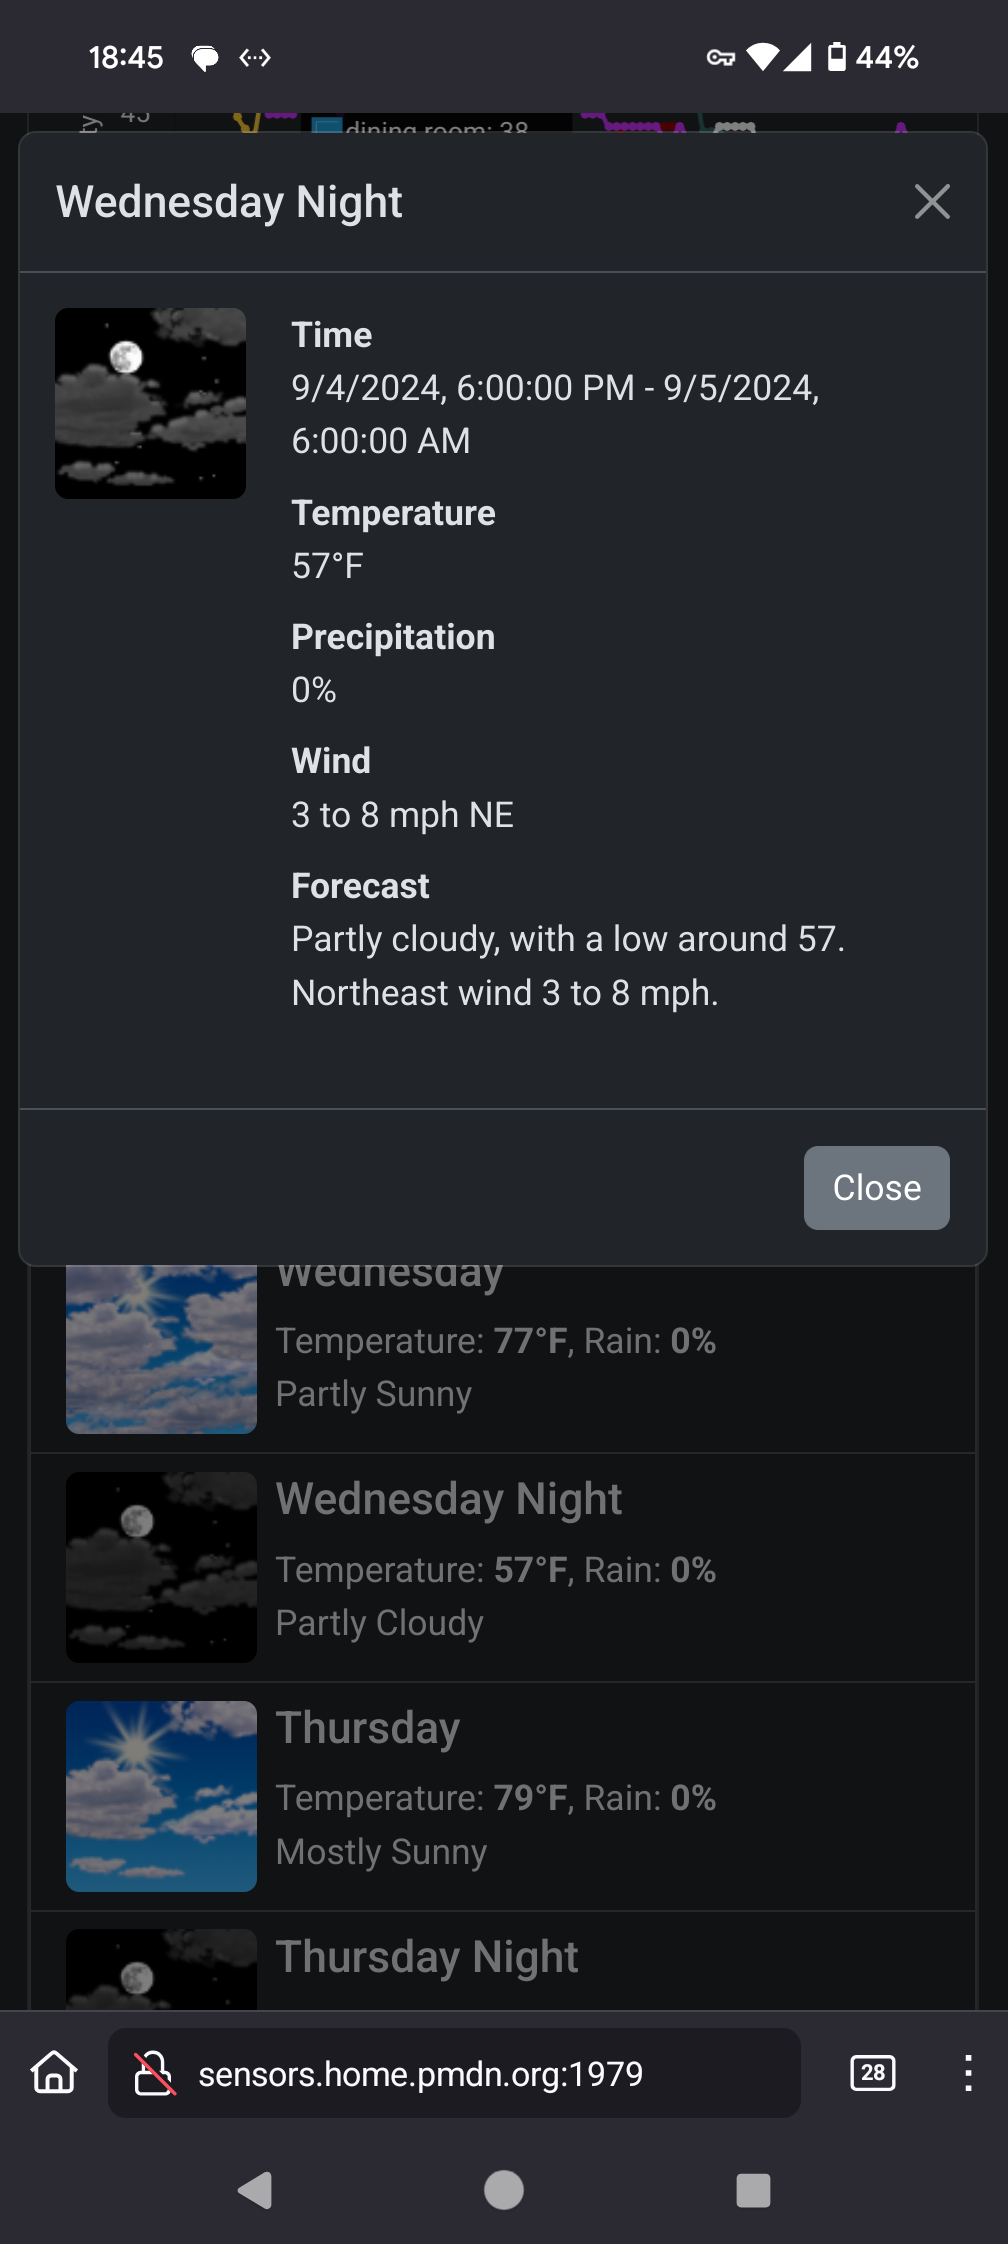
Forecast Details dialog:
Forecast details dialog in the desktop web interface (2024).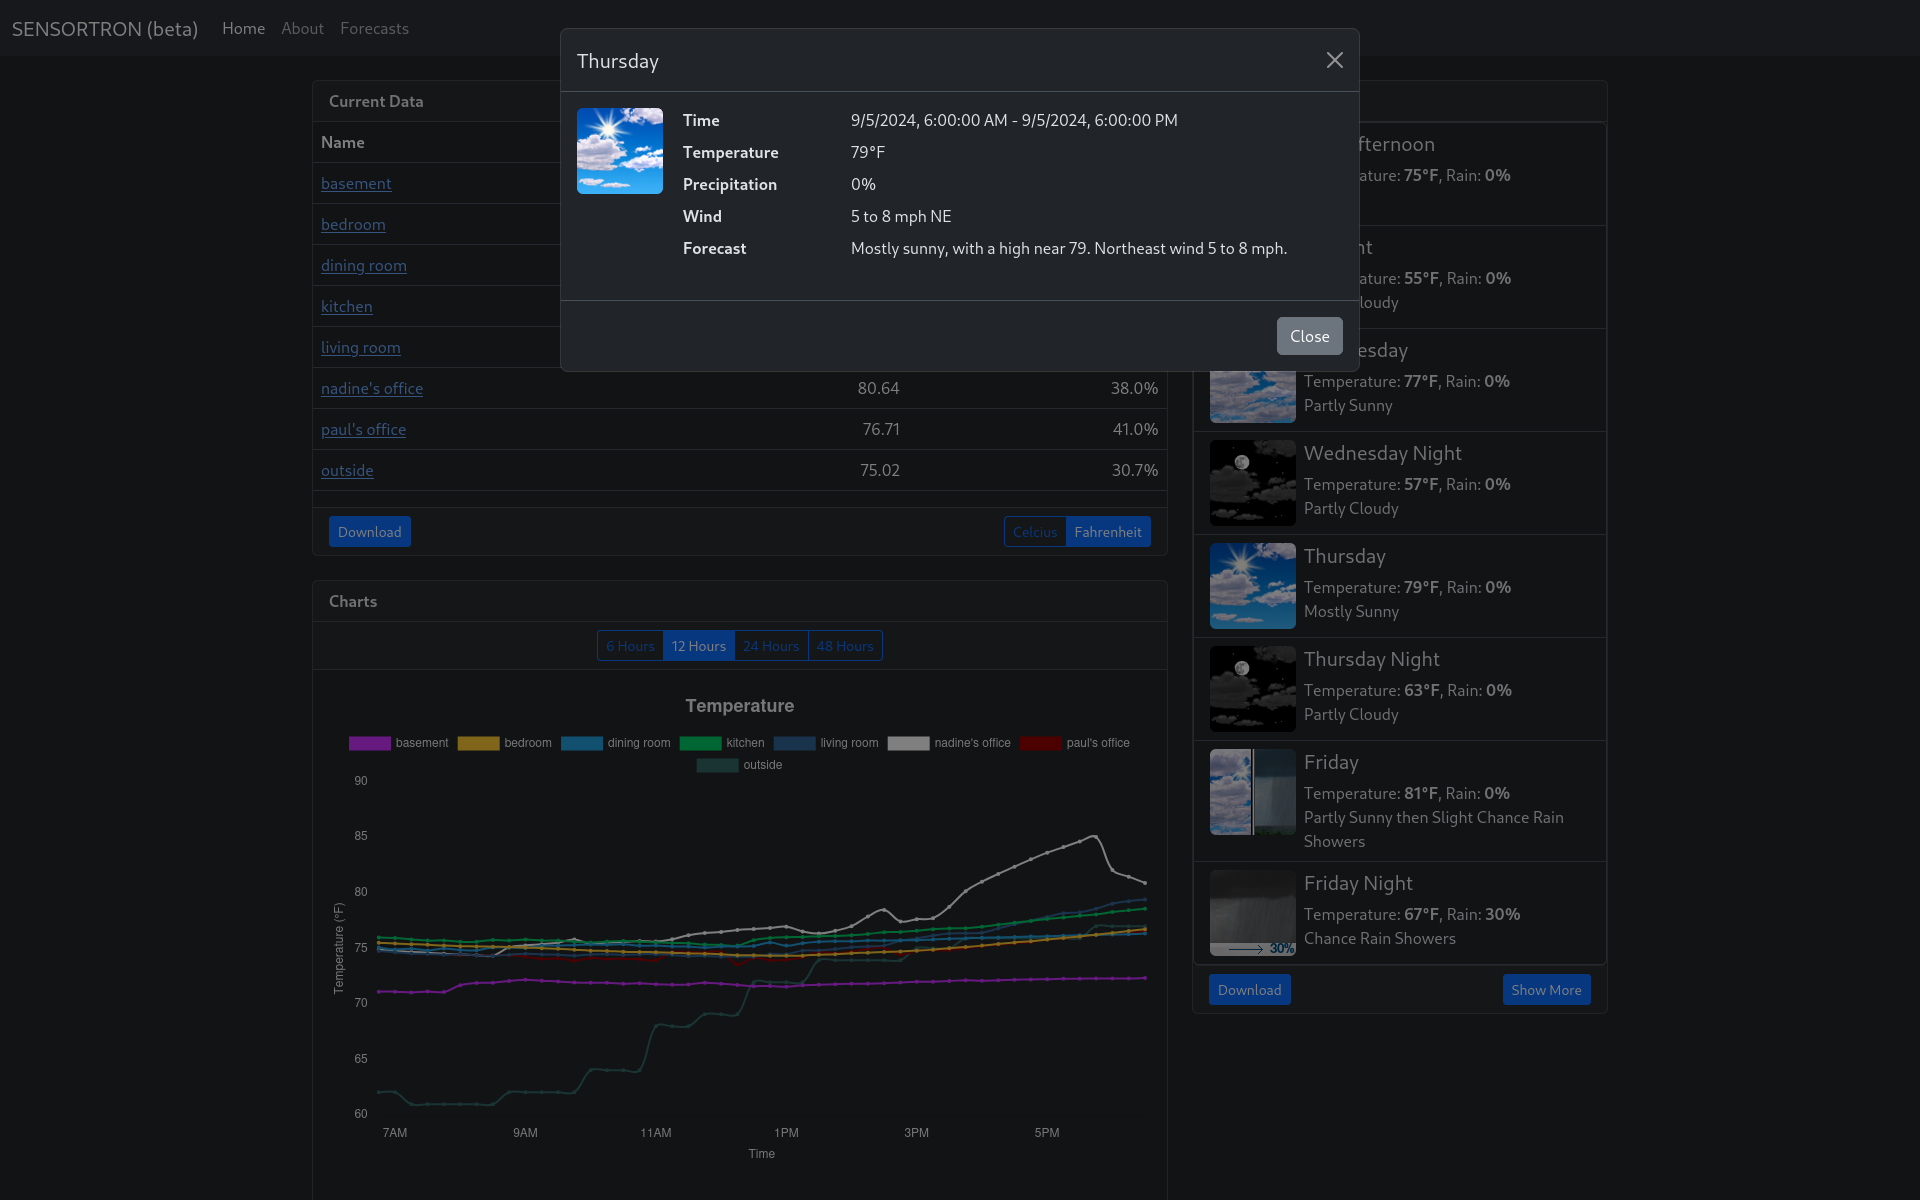
The web interface is responsive so it works just as well on mobile. Here are screenshots of the same interface components on my phone: