Total 2023 energy production and consumption.
Last year we got rooftop solar. The picture above is our Enphase dashboard, which shows how the solar panels performed in 2023.
The blue bars indicate the energy produced by our solar panels and the orange bars indicate the energy consumed by our house, in megawatt-hours (MWh).
The relevant values are:
- Consumed: Total energy consumed by our house.
- Produced: Total energy generated by our solar panels.
- Net Imported: Energy we are actually billed for.
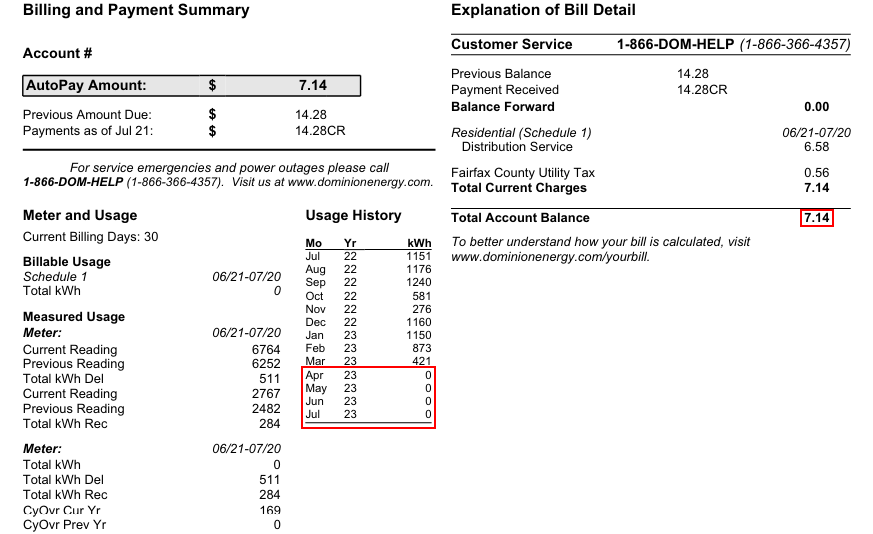
Any excess energy that we produce is exported back to the grid and credited to our account (net metering), so our power bills during the spring and early summer look like this:

Our July power bill with monthly usage and amount due highlighted.
The sections of the bill highlighted in red show the following, respectively:
- Four months of zero net energy use.
- A bare minimum power bill.
Savings
Here’s a breakdown of the money we saved this year from solar:
| Description | Amount ($) |
|---|---|
| Energy Produced (6.2 MWh, $0.14/kWh) | $868.00 |
| Fairfax County Solar Energy Equipment Tax Exemption | $260.25 |
| SRECs | $179.52 |
| Total | $1307.77 |
Notes:
- The solar panels offset 62% of our energy use for the year (6.2/9.9 = ~0.62) and saved us $868.00 (6200 kWh * $0.14/kWh = $868).
- We received a $260.25 property tax exemption from the Fairfax County Solar Energy Equipment Tax Exemption.
- We generated 6 solar renewable energy credits (SRECs) in 2023 and 5 have been sold. We received $179.52 for them (after fees).
The expected lifetime of the solar panels is 20 years. We expect to recoup the initial installation cost in 11-13 years.
That’s longer than usual (most folks try to break even in 5-8 years), but we’re okay with it; our house is partially shaded and our panel placement is deliberately less than optimal for aesthetic reasons.